Operator manual · General
Help Desk vs Service Desk: Which One Your Team Needs
In short
Help desk vs service desk compared by scope, ownership, metrics and cost, with a clear pick for each team situation and sourced figures.
DBotMaker research desk · Updated November 20, 2026 · 13 min read
Two support teams can buy the same ticketing product and both end up with the wrong model. One needed a fast break-fix queue and pays for approval workflows nobody configured. The other needed approvals and routes every access request through a queue built for password resets.
The labels don't settle it, because the labels aren't standardized. IBM's own reference describes the service desk as an ITSM foundation and a superset of the traditional help desk, which makes the difference one of operational scope and governance rather than product naming (IBM's guide to the service desk).
The call itself is simple. A help desk is right when the dominant job is restoring one user's broken service fast. A service desk is right when requests need approvals, named owners and governance across IT. The rest of this guide shows how to confirm which of those describes your queue, and what each one costs to run.
Table of Contents
- Help Desk vs Service Desk at a Glance
- Scope Follows Ownership, Not the Label
- Metrics to Track for Each Model
- What the Broader Model Costs to Run
- Which Model Fits Your Team's Situation
- Confirm the Model Before You Buy
Help Desk vs Service Desk at a Glance
The verdict comes before the shortlist. Pick a help desk when the dominant work is restoring one broken service quickly. Pick a service desk when requests need approvals, named owners and governance across IT. Four criteria settle almost every buying conversation.
Help desk and service desk compared on core criteria
| Criterion | Help desk | Service desk |
|---|---|---|
| Core purpose | Restore a user's disrupted service quickly | Manage the user's whole interaction with IT as a service |
| Scope | Mainly incident management and break/fix work | Incidents, service requests, change, problem and knowledge management |
| Typical workload | Login failures, software errors, basic how-to questions | Access requests, approvals, software installs, outage communication |
| Point of contact | One support queue for technical faults | Single point of contact for users and IT services |
Nothing in that table depends on the name on the box. Vendors use help desk and service desk interchangeably, particularly in customer support, and a product page rarely states which operating model it was built for.
Where the labels stop being reliable
Atlassian's 2016 explanation of the split notes that early help desks generally had no formal fix targets and that immediate fixes were infrequent, which is why the term still carries a tactical reputation; the broader service-desk concept arrived later, shaped by ITIL's service-management model (Atlassian, 2016). That ITIL framing is the one worth carrying into a purchase decision, because it describes an operating model rather than a feature list.
Software follows the same drift. A tool marketed as a help desk often ships an approval engine. A platform sold as a service desk often runs on the same ticket table underneath. Compare the workflows each product supports, the ownership fields, the approval paths and the reporting, not the category in the navigation menu.
The one-question test to run first
Pull last month's tickets and split them into two piles. Pile one is break/fix incidents: a locked account, a failed printer, an application that won't launch. Pile two is everything that needed an approval, a provisioning step or a change record: new-hire access, a software install with a licence check, a server change with a rollback plan.
The split decides the model. A queue that's mostly pile one needs a help desk and the shortest path back to restoration. A queue where pile two is large, or where pile two is being handled as if it were pile one, needs service-desk structure. DBotMaker's help desk ranking compares 10 help desk products, from seat-priced suites to ticket-priced ecommerce tools, a range that only helps once you know which category your ticket mix belongs to.
Scope Follows Ownership, Not the Label
The help desk is the older term. It emerged in the late 1980s as an IT support capability built around reactive, break/fix work: receive the user's reported fault, restore service, close the ticket. The service desk came out of the UK government's IT Infrastructure Library, developed by the Central Computer and Telecommunications Agency and first released in 1989.
The definition that matters operationally is ITIL's own. ITIL's 2011 glossary defines the service desk as "the single point of contact between the service provider and the users", and states that a typical service desk manages incidents and service requests while handling communication with users (Atlassian on help desk vs service desk). Read that as a statement about ownership and entry points. It says nothing about which screens a product ships with, which is why vendor naming is the worst possible basis for the decision.
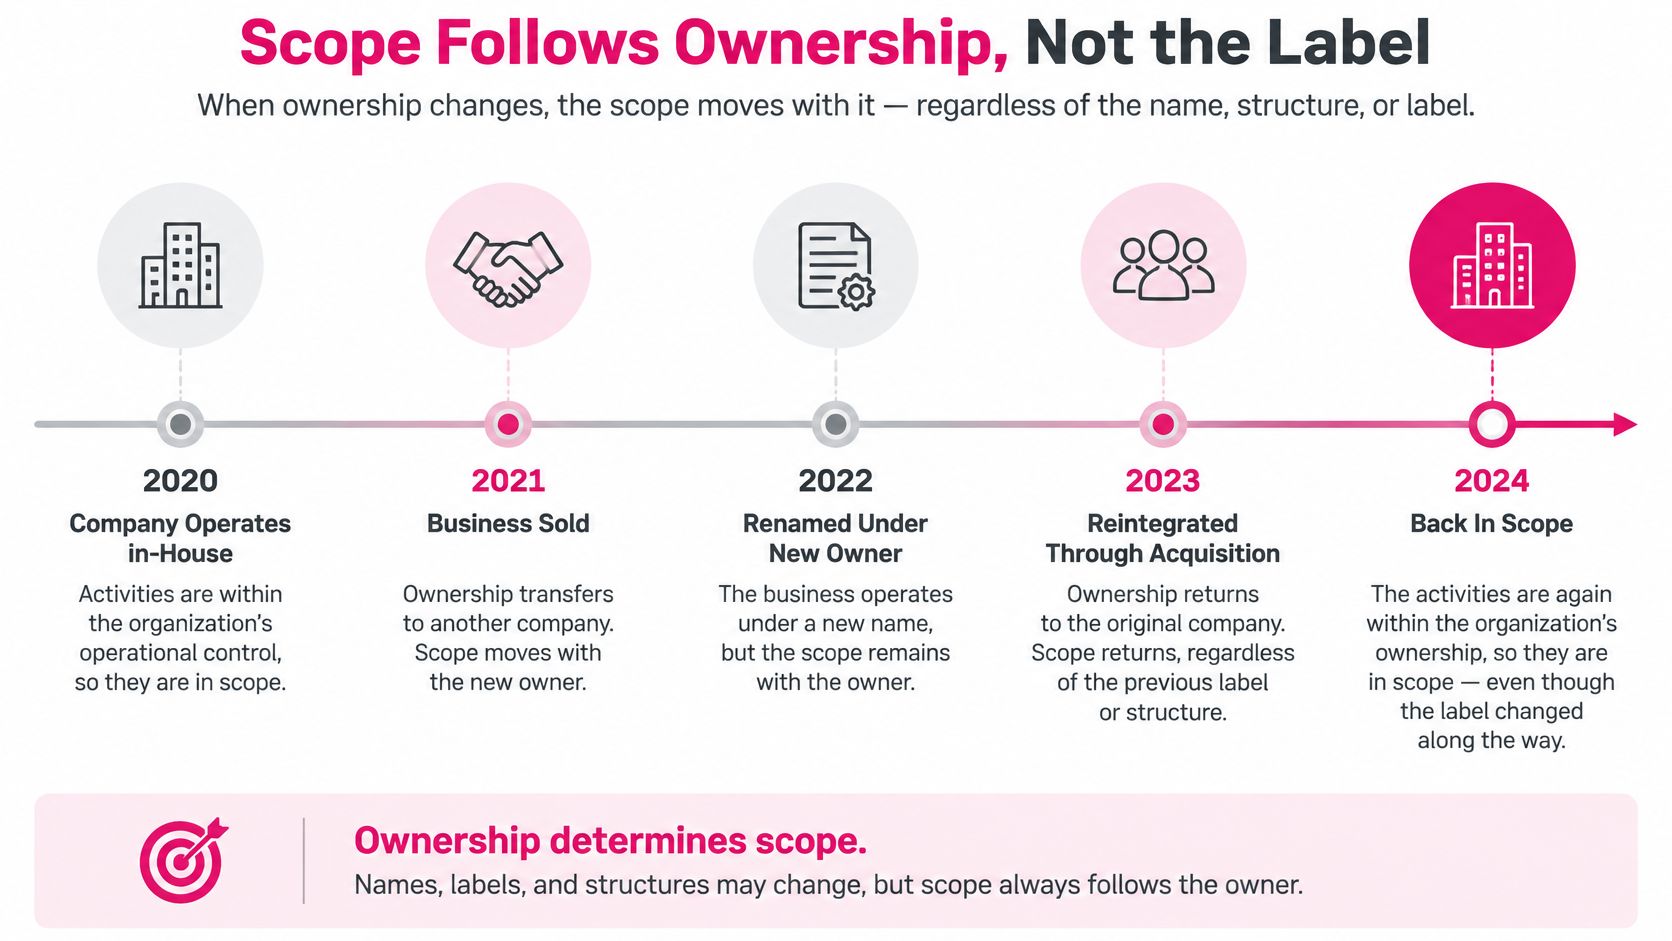
The timeline below shows how ownership, rather than the product name, moves the boundary between the two models.
One task, two owners
A password reset is the cleanest test case, because the same activity belongs to either model depending on what the team owns. It is help-desk work when the goal is immediate restoration: the user is locked out, someone resets it, the ticket closes.
The same reset becomes service-desk work when the team also owns identity-request approval, self-service, knowledge upkeep, access governance and analysis of recurring lockouts. Privileged accounts need a second approver. The self-service article that would deflect a share of those calls needs someone to write and maintain it. Repeated Monday-morning lockouts point to an account policy that is wrong, not a queue that is slow. None of that fits inside an incident ticket, and all of it changes who you hire and what software you buy (Atlassian's service request comparison).
Scope follows ownership, not the label on the product.
Four questions that set scope
Run these against the biggest request types in your queue, and answer them based on how work really flows today rather than how you want it to flow.
- Who owns the request? One shared support queue, or a named owner per request type with an escalation path.
- Do approvals or change records apply? If a manager, a budget holder or a change advisory step has to sign off, the workflow is service-desk territory.
- How is success measured? Speed of closure alone points to a help desk. Service-level targets, fulfillment time and availability point to a service desk.
- Does the team prevent recurrence? If nobody owns root cause, the same incidents return and the label on the tool changes nothing.
Vendors and internal teams use the two names interchangeably, especially in customer support, so the questions carry more weight than the category on the pricing page. They are also portable. They work on ServiceNow, Jira Service Management and a shared inbox alike, and the payoff of a correct answer shows up twice: faster closure on the tickets that remain, and demand that never reaches the queue at all.
Metrics to Track for Each Model
The metric set is a symptom of the model. Change the model and the dashboard should change with it. The comparison that anchors these rows, from Zendesk, puts indicative help-desk first-contact resolution at roughly 70 to 80% and service-desk self-service adoption at about 30 to 40%, while tying service desks to SLA-based resolution targets and broader availability reporting (Zendesk's help desk vs service desk comparison).
Metrics by model and what each one shows
| Metric | Help desk reporting | Service desk reporting | Why it matters |
|---|---|---|---|
| First-contact resolution | Core measure, indicative benchmark 70-80% | Paired with repeat-incident rate | Fast closure that recurs hides reliability loss |
| Mean time to resolution | Speed per ticket | MTTR by priority | Separates urgent failures from routine work |
| Service-request fulfillment time | Rarely tracked | Core service measure | Shows whether approved requests finish on time |
| SLA achievement | Often informal | Formal target | Makes service levels reportable |
| Self-service adoption | Secondary | Indicative benchmark 30-40% | Shows demand moving out of the queue |
| Repeat-incident rate | Rarely tracked | Core control measure | Reveals root causes that closure volume hides |
| Change-success rate | Not applicable | Tracked | Shows whether controlled changes hold |
| Reopen rate and user-confirmed resolution | Rarely tracked | Core control measure | Catches tickets closed while users still see the problem |
Where the benchmarks come from
Vendor datasets are useful and narrow. Freshservice reported a 74.14% first-contact resolution rate for IT tickets in 2025, based on 2024 data from its own customer base, which makes it a vendor figure rather than a market standard (ScreenMeet's IT service desk statistics).
Treat every number in this section as directional. Ticket mix, severity definitions, staffing levels and automation change the result more than the tool does. A 70-80% first-contact figure means something different for a team that closes 40 tickets a week than for one that closes 4,000.
Rules for the dashboard
- Segment by priority and request type. A blended average hides the four-hour P1s inside a comfortable 18-hour mean.
- Report speed and recurrence together. Resolution time next to repeat-incident rate, always, on the same panel.
- Never reward closure volume alone. A fast closure that causes a repeat incident improves activity metrics while the service gets worse.
- Track reopen rate and user-confirmed resolution. A ticket the user disputes is not a resolution, whatever the status field says.
- Cut the metrics that don't match your model. A help desk doesn't need change-success rate. A service desk that ignores fulfillment time has bought workflow it doesn't measure.
Keep only the metrics that fit the model you picked, and put the rest in a backlog until the model changes.
What the Broader Model Costs to Run
The price of the broader model is process overhead, not a different ticketing label. A help desk can start with a basic ticket queue and a troubleshooting procedure, and a small team can be running it in days.
ManageEngine's comparison describes help desks as reactive and centered on incident management and quick restoration, with potentially informal service targets. It describes service desks as proactive and aligned with IT service management, with formal service-level agreements, defined metrics and responsibilities, and coverage that can reach into incident, service-request, change, problem and knowledge management (ManageEngine's help desk vs service desk comparison).
What a service desk adds in admin work
Those mechanics create real implementation work before anyone resolves a ticket:
- Request categories that map to how the business asks for things, not to the vendor's default taxonomy.
- Approval paths with named approvers and a rule for what happens when one is on holiday.
- Ownership and escalation so an unassigned request has somewhere to go after the first hour.
- Service targets and reporting fields, which means agreeing what counts as late before you can report on it.
- A service catalog with workflows for repeatable requests such as access provisioning or software installation.
The trade-off is honest. The broader scope stops requests being handled as ad hoc incidents, which is where hidden cost accumulates. It also adds administration and governance work that someone has to do every week.
Two buying checks
Check the pricing unit. A help desk plan is usually sold per seat, while AI service desk layers increasingly price per resolution, session or conversation. Each entry in the AI IT service desk ranking shows that unit next to the seat price, because a cheap seat can beat an expensive one on the invoice and lose badly at volume. The ranking covers service desks with a built-in virtual agent and AI layers that sit on top of ServiceNow or Jira, which is the range worth comparing if an agent will absorb the repetitive work (AI IT service desk agents compared).
Quote every price with the seller and the date you checked it. List prices move, trials shrink, and a figure from a review written eight months ago is a starting point for a conversation, not a budget line.
Practical rule: adopt service-desk controls when they solve a coordination problem you already have. If nobody has ever asked who approved a request, you're buying governance for a risk you haven't met.
Which Model Fits Your Team's Situation
The shape of the work decides the model. Company size is a weak predictor. Five situations cover most decisions.
Which model fits each common case
| Situation | Better fit | Deciding requirement |
|---|---|---|
| Mostly break/fix faults for a small team | Help desk | Fast restoration with a basic queue |
| Requests that need approvals or entitlement checks | Service desk | Approval paths and clear ownership |
| Frequent access provisioning or software installs | Service desk | Repeatable request catalog |
| Changes that need controlled rollout | Service desk | Change records and success tracking |
| Same incident returns every month | Service desk | Problem management and recurrence analysis |
What decides each case
A five-person IT team whose queue is mostly locked accounts and printer faults gains nothing from a service catalog. The work is restoration, the volume is low, and every hour spent designing approval paths is an hour not spent fixing machines. A help desk with a clean queue and a short troubleshooting guide is the whole answer.
A 300-person company is a different problem even if the ticket count looks similar. New hires wait days for application access, nobody knows who signs off, and the requester chases three people for a status. A request catalog with named approvers and a visible status fixes that. So does an AI agent that takes password resets, locked accounts and software access requests off the queue and answers them in Slack or Microsoft Teams. That is the use case behind the AI IT service desk agents ranking, which compares six products including Jira Service Management, Atomicwork, Freshservice, Zendesk Employee Service, Siit and Moveworks.
A support team fielding customer questions is deciding something else entirely. There, ticket volume and the handoff to a human decide the tool. The label on the product page is noise.
Check the channel before the feature set
Channel is the case that catches phone-heavy teams. Ivanti's 2024 IT Service Management Trends research found that 47% of office workers used the phone to contact the service desk (Ivanti's ITSM research). A plan built around a web portal and an email queue can leave a large share of that demand unrecorded.
Staff the phone line, log the calls as tickets, and check that the tooling records them in the same place as portal submissions. A service desk with a polished catalog and no call logging produces a dashboard that misses every request that arrived by phone.
The recurring-outage case is the clearest switch signal. When the same incident returns every month, the team needs problem management and someone accountable for root cause. That is a service-desk requirement even in a ten-person company.
Confirm the Model Before You Buy
The default holds: a help desk for isolated break/fix work, a service desk when requests, approvals and recurring incidents need one governed entry point.
Then check whether either model is reaching your users. Research on office workers keeps surfacing the same gap: tickets get marked resolved while the problem stays open, people lose their own time working around an issue nobody fixed, and deadlines slip as a result.
That gap undercuts the assumption that the more mature model automatically delivers better service. A portal, a formal SLA and a broad ITSM scope can improve governance and still leave employees stuck, especially when they bypass the queue and ask a colleague instead. A model that looks complete on paper can still leak demand into hallway conversations.
Measure the demand that never reaches the queue
Add four things to whichever dashboard you build: ticket avoidance, repeat contacts, reopen rate and user-confirmed resolution. Track time to productivity for new hires and work lost when an issue drags on. None of these appear in a standard response-time report, and all of them describe whether support is working.
Pair those with one count the queue cannot show you: how often the same person comes back within a week on the same issue. Repeat contact rate is the cheapest proxy for resolution quality, and a service desk that reports only closure speed will hide it.
Four steps before you sign
- Count 90 days of tickets by type. Break/fix incidents in one column, approvals, provisioning and change records in the other.
- Shortlist two products and score both on the same written criteria. Same weights, same evidence, no demo-day exceptions.
- Read each spec sheet for starting price, free plan or trial, integrations, and whether you can buy without talking to sales. Record the seller and the date you checked, because list prices change and enterprise vendors that only quote on request are marked as pending.
- Run a 30-day pilot that measures reopens and user-confirmed closure. Speed alone tells you what the queue did, not what the service delivered.
Each ranking opens with that spec sheet, so the comparison starts from published prices rather than a sales call, and the decision bot scores a single question on capabilities, setup and value when two options look identical on paper (best help desk software compared). The best choice is the model that captures and reduces demand, not the one with the larger feature set.
Run the split on last month's tickets before the next demo. Count the break/fix incidents, count the requests that needed an approval, a provisioning step or a change record, and write both numbers down. If the totals surprise you, send them, plus the product you're already considering, to editorial@dbotmaker.io: every message reaches the research desk and each one is read. The count decides the category, so start with the count.
Spotted an error in this guide? Email editorial@dbotmaker.io